


|
|||||||||||
|
|
|
|
|
|
|
|
|
||||
|
Click on the screen shot to enlarge
|
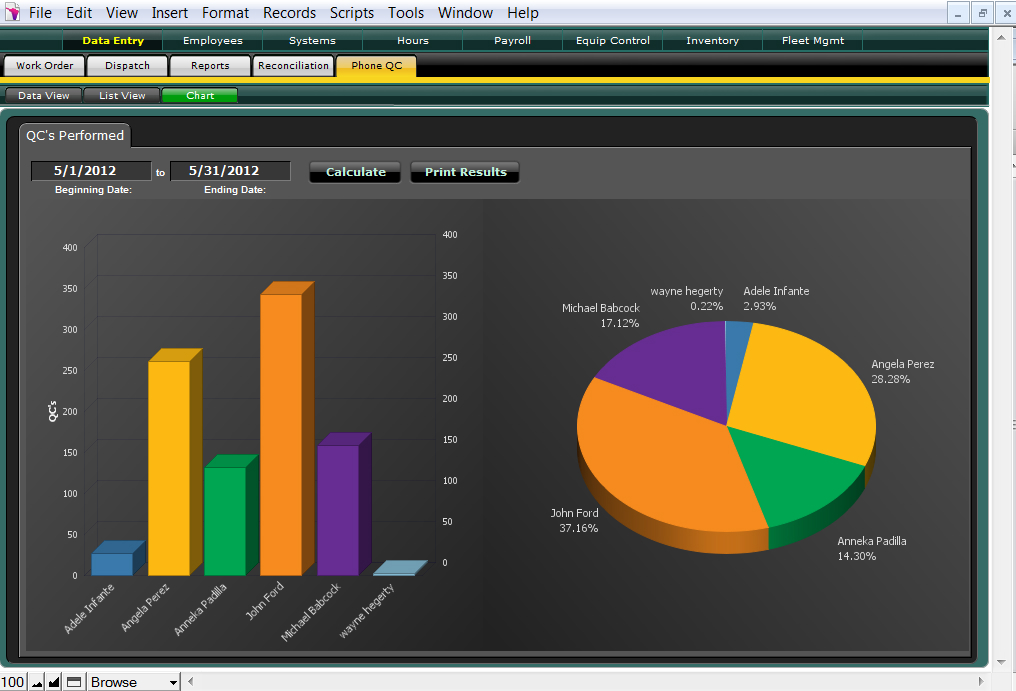
Need to see who is performing post calls and who isn't? A click of the mouse will give you your answers. 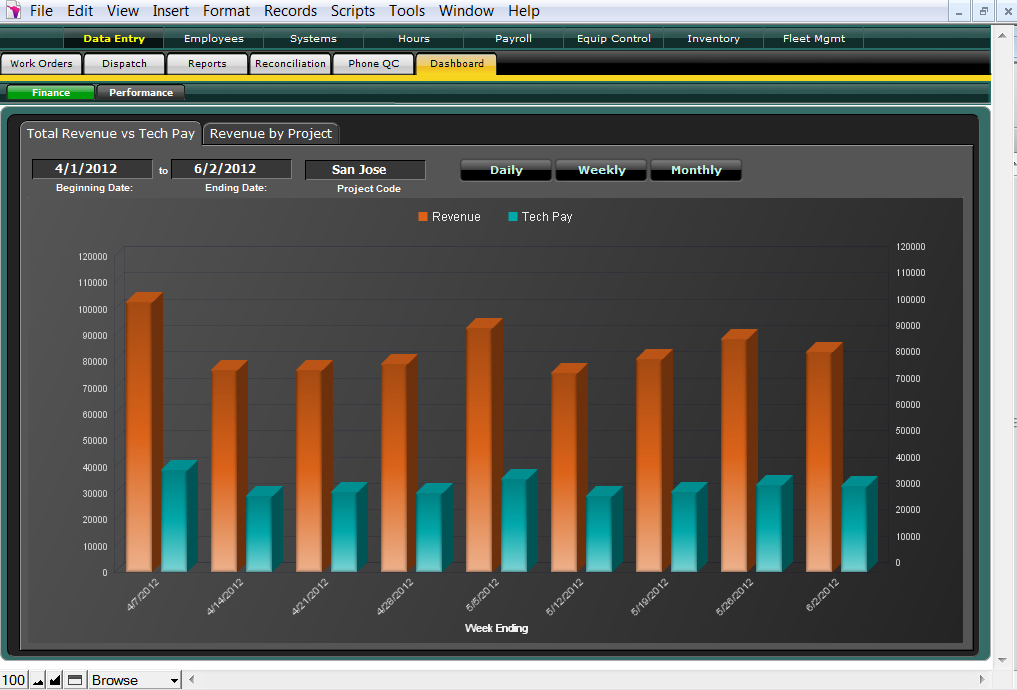
Generate charts to show Revenue vs Production over a period of time. View Daily, Weekly or Monthly totals. View totals company wide or break them out by Project. 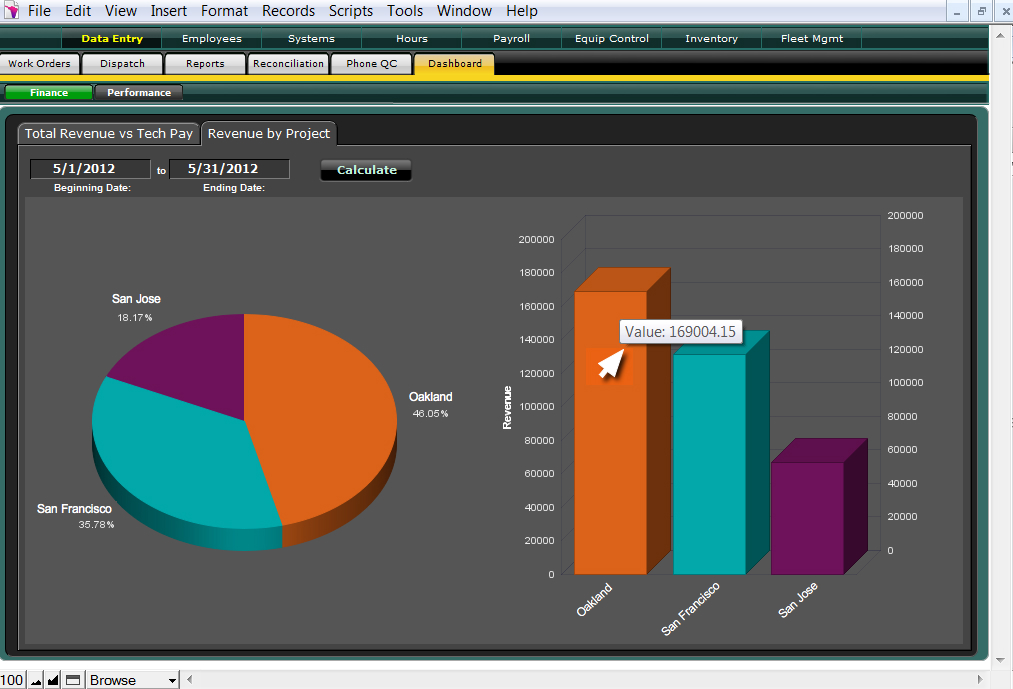
With the click of a mouse, you can compare projects to see how each is performing within a selected date range. 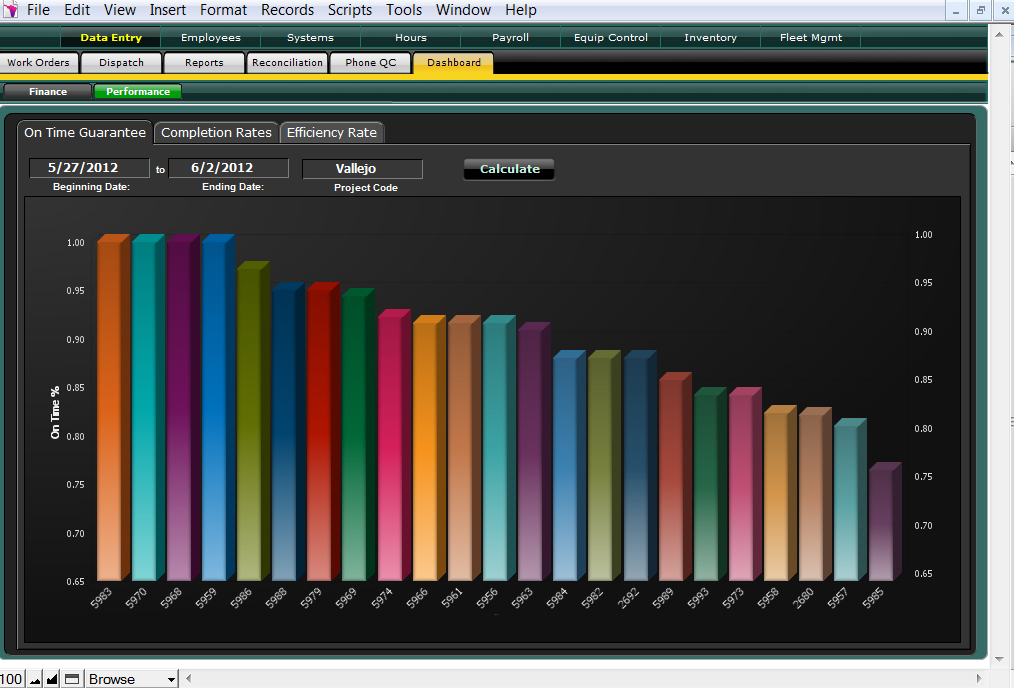
Are your techs meeting their On-Time Guarantees? 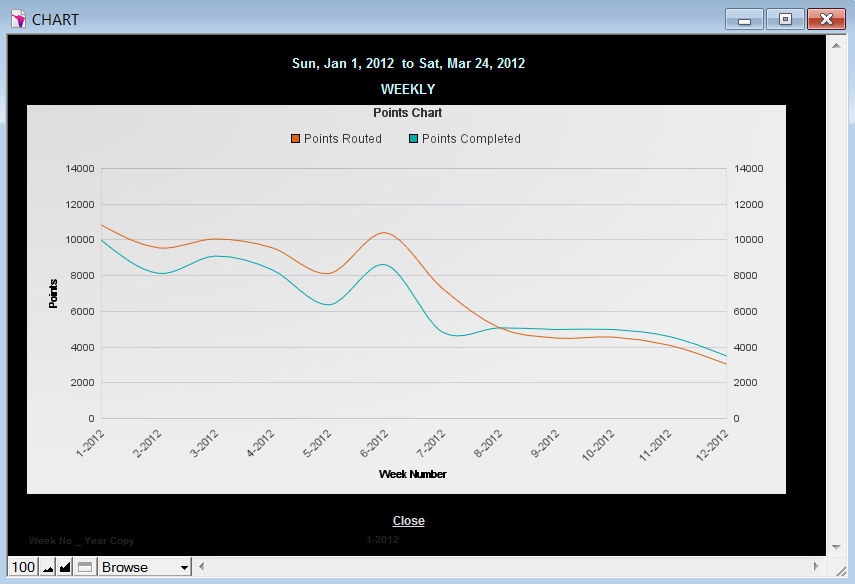
Are your techs completing all the points routed to them? |
|||||
| 8748 Westlake Drive * Greendale, WI 53129 * Phone 414-690-1513 |